Chapter 9 Results
This chapter describes the kinds of output the City Digital Twin (CDT) platform produces as it runs. Reports, datasets, modeling results, and target-indicator tracking all become the foundation for sound decisions, program planning, support of management processes, and presenting information to external stakeholders. The chapter shows how the data the platform collects and processes turns into manageable digital assets that you can access in a range of formats — from dashboards to machine-readable exports and reports that meet federal requirements.
9.1 Reports the platform produces
One of the key results the City Digital Twin platform delivers is automated reporting that meets the requirements of government bodies, regional administrations, and the relevant agencies. The CDT lets you move from manual data collection and form preparation to a centralized, repeatable, and documented reporting system.
The platform produces the following types of reports:
- Structured tables — in XLSX and CSV formats, following the templates of federal and regional authorities;
- Program and scenario passports — with full justification, indicator calculations, visualizations, and modeling results;
- Target-indicator reports — for national projects, state programs, and socio-economic development strategies;
- Comparative reports — across scenarios, periods, territories, and programs;
- Integration exports — for transfer to external information systems;
- Analytical notes — in DOCX, PDF, and HTML formats, with explanations, conclusions, and charts.
The platform builds each report from the ETL calculation modules and the visual interface, ships it with a digital passport, and can reproduce it whenever you need to check or revisit a decision.
The platform supports versioning of report forms and export to external media. This sharply reduces the risk of inconsistent data and builds trust in the management decisions you make.
9.2 Datasets and databases
As the City Digital Twin platform runs, it builds and accumulates structured datasets and databases that serve as the basis for calculations, monitoring, scenario analysis, and reporting. Analysts, government bodies, and the customer’s IT teams can work with this data through visualization interfaces and the API.
The key datasets the platform produces include:
- Normalized socio-economic data — broken down by year, territory, category, and source;
- Calculated indicators — values produced by running the models (for example, indices of sustainability, balance, and deficits);
- Scenario parameters — alternative development paths, control variables, assumptions, and reference values;
- Target indicators — values that align with the goals of national projects, development programs, and agency strategies;
- Historical versions — datasets broken down by version, which let you trace how indicators and decisions evolved;
- Metadata and source passports — information on origin, load time, calculation rules, the models used, and accountability.
The data lives in a centralized system built on ClickHouse, which delivers fast queries and scalability. You can export it in machine-readable form (CSV, JSON, XML), prepare integration flows, and access the tables through the API.
The platform uses these databases not only internally but also as a source of information for other digital systems — regional analytical information systems, industry BI, and analytical centers. Together they form the knowledge base you need to make decisions, develop programs, report, and track progress toward goals.
9.3 Modeling results
The City Digital Twin platform produces a wide range of modeling results, covering both basic socio-economic calculations and complex scenario forecasts. These results become the foundation for justifying management decisions, planning programs, and assessing how sustainable a territory is.
On the platform, you get:
- Forecast values for key indicators — demographics, employment, income, investment, budget capacity, and more;
- Index scores and aggregates — development sustainability, degree of balance, and sector deficits or surpluses;
- Intersectoral and cross-level links — assessments of how one parameter affects another, along with coupled effects and dependencies;
- Scenario comparisons — how indicators change when you move from a baseline scenario to an investment or alternative one;
- Risk and sensitivity diagnostics — how the outcome shifts when one or more parameters fluctuate;
- Scenario passports — a full description of the parameters, sources, and results of a calculation, ready to submit to a governing body or analytical center.
You can access modeling results both interactively (through the web interface) and as machine-readable tables, reports, and visualizations. The platform documents every calculation, ships it with the model version, and can reproduce or recalculate it when the source data changes.
The CDT models are not locked into hard-coded algorithms — when needed, the customer can plug in their own scenarios, configure variables, or set additional constraints.
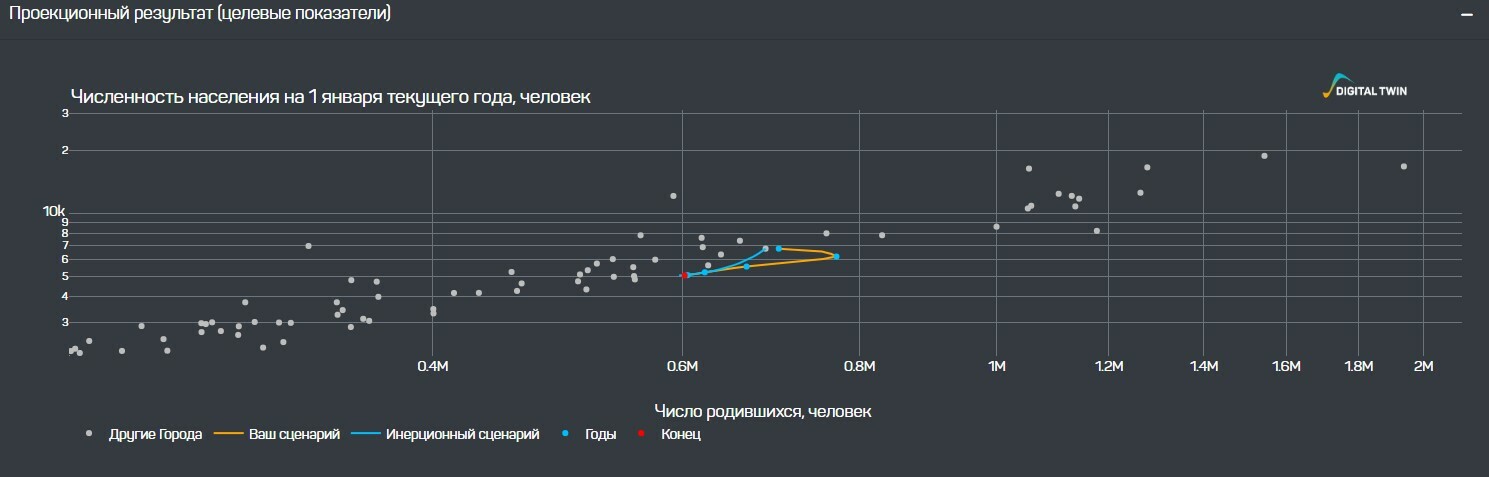
Figure 6 — Projected result of scenario modeling: a forecast of a territory’s population dynamics
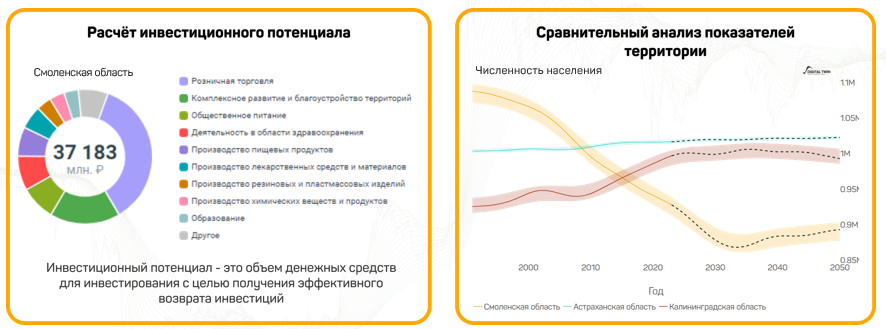
Figure 15 — Calculating a territory’s investment potential and comparing socio-economic development indicators across regions
9.4 Tracking goal achievement
One of the most important functions of the City Digital Twin platform is to track the achievement of socio-economic development goals at different levels of governance. The system lets you monitor current values of target indicators, compare them against planned values, and spot deviations in near real time.
The platform tracks the following areas:
- National goals and key performance indicators (KPIs) — the platform automatically maps actual data against the targets set by Russian Presidential decrees and federal programs;
- Regional strategies and state programs — the platform calculates goal-achievement indicators at the level of a federal subject (region) or municipality;
- Sector and interagency indicators — used to assess how sector programs are being carried out;
- Dynamic deviation monitoring — the platform flags indicators with statuses such as “on track,” “at risk,” and “off track,” so you can respond quickly;
- Execution history — stored as time series, which lets you analyze progress and the causes of setbacks by year, quarter, and region.
The platform uses visual analytics — color coding, trend charts, and deviation tables — to make goal tracking clear and accessible for analysts and managers alike.
When the system detects a risk that a target won’t be met, it lets you build a correction scenario and assess which resources and measures you need to get back on track.
In this way, the CDT not only calculates and visualizes goals but also manages their achievement proactively — which is critical when you’re working with state programs, KPIs, and oversight from external auditors.
All rights reserved Digital Twin LLC All rights reserved Digital twin LLC